Is there a tie-breaker to determine whether the AP News or Apples Two Apples analysis is more accurate? As a matter of fact there is.
In order to determine whether the Apples Two Apples or AP News results are more likely to be accurate we looked for another source of drug pricing data. In fact Medicare also publishes drug pricing data. Despite delayed updates and fewer medications the Medicare data can help bound the solution space. The Medicare trends are compared to the results in Part 1 of our series. Here an S-curve of price increases from 2012 till 2016 is plotted.
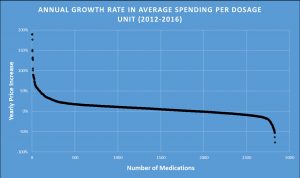
- 2012-2016 Medicare data:
- ~67% of medications went up in price
- Many drug prices (~15%) don’t change significantly
- 2828 medications measured
- 2017-2018.8 NADAC data:
- ~47% of medications went up in price
- Many drug prices (~12%) don’t change significantly
- 4496 medications measured
- The ratio of increasing drug cost:
- AP has a 96:1 ratio
- NADAC has a ~1:1 ratio
- Medicare has a ~2:1 ratio
- 30-drug apples to apples comparison is in this range
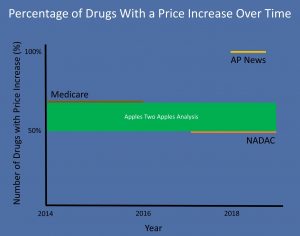
Three sources of data are reflected above. Certainly ~50-65% of drugs go up in price every year. This is a wide range because Medicare pricing is from 2014-2016 while NADAC is from 2017-2018.8, the Medicare drug list is ~half as large as NADAC, and price changes are less than +/-2.5% for 12-15% of the medications. For this reason a range based on the boundaries found rather an average is applied.
Hence Apples Two Apples analysis diverges from the AP News claim of 96 price increases per 1 decrease. This would mean nearly 100% of the drugs increase in price every year which seems unlikely.
Apples Two Apples works hard to provide bias free, validated, and transparent analysis. After analyzing three data sets from three public sources we’ve provided an even broader and consistent view of drug pricing. We will continue to add more analysis with your support.
Be First to Comment